Note
Go to the end to download the full example code.
Tabular Regression with scikit-learn
This example shows how you can create a Hugging Face Hub compatible repo for a tabular regression task using scikit-learn. We also show how you can generate a model card for the model and the task at hand.
Imports
First we will import everything required for the rest of this document.
from pathlib import Path
from tempfile import mkdtemp, mkstemp

import matplotlib.pyplot as plt
from sklearn.datasets import load_diabetes
from sklearn.linear_model import LinearRegression
from sklearn.metrics import mean_absolute_error, mean_squared_error, r2_score
from sklearn.model_selection import train_test_split
from sklearn.pipeline import Pipeline
from sklearn.preprocessing import StandardScaler

import skops.io as sio
from skops import card
Data
We will use diabetes dataset from sklearn.
X, y = load_diabetes(return_X_y=True)
X_train, X_test, y_train, y_test = train_test_split(
    X, y, test_size=0.2, random_state=42
)
Train a Model
To train a model, we need to convert our data first to vectors. We will use StandardScalar in our pipeline. We will fit a Linear Regression model with the outputs of the scalar.
model = Pipeline(
    [
        ("scaler", StandardScaler()),
        ("linear_regression", LinearRegression()),
    ]
)

model.fit(X_train, y_train)
Inference
Let’s see if the model works.
y_pred = model.predict(X_test[:5])
print(y_pred)
[139.5475584 179.51720835 134.03875572 291.41702925 123.78965872]
Initialize a repository to save our files in
We will now initialize a repository and save our model
Create a model card
We now create a model card. We will see below how we can populate the model card with useful information.
model_card = card.Card(model)
Add more information
So far, the model card does not tell viewers a lot about the model. Therefore, we add more information about the model, like a description and what its license is.
limitations = (
    "This model is made for educational purposes and is not ready to be used in"
    " production."
)
model_description = (
    "This is a Linear Regression model trained on diabetes dataset. This model could be"
    " used to predict the progression of diabetes. This model is pretty limited and"
    " should just be used as an example of how to user `skops` and Hugging Face Hub."
)
model_card_authors = "skops_user, lazarust"
citation_bibtex = "bibtex\n@inproceedings{...,year={2022}}"
model_card.add(
    folded=False,
    **{
        "Model Card Authors": model_card_authors,
        "Intended uses & limitations": limitations,
        "Citation": citation_bibtex,
        "Model description": model_description,
        "Model description/Intended uses & limitations": limitations,
    },
)
Card(
  model=Pipeline(steps=[('scaler', Standar..._regression', LinearRegression())]),
  Model description=This is a Linear Regression ...`skops` and Hugging Face Hub.,
  Model description/Intended uses & limitations=This model is ... in production.,
  Model description/Training Procedure/Hyperparameters=TableSection(14x2),
  Model description/Training Procedure/Model Plot=<style>#sk-co...script></body>,
  Model Card Authors=skops_user, lazarust,
  Citation=bibtex @inproceedings{...,year={2022}},
  Intended uses & limitations=This model is made for ...o be used in production.,
)
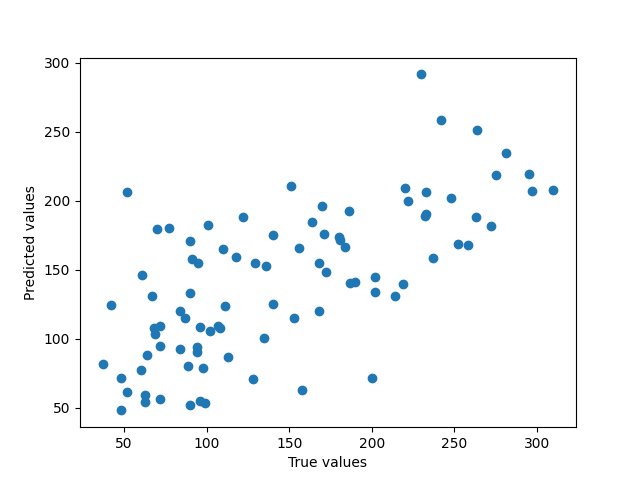
Add plots, metrics, and tables to our model card
We will now evaluate our model and add our findings to the model card.
y_pred = model.predict(X_test)

# plot the predicted values against the true values
plt.scatter(y_test, y_pred)
plt.xlabel("True values")
plt.ylabel("Predicted values")
plt.savefig(Path(local_repo) / "prediction_scatter.png")
model_card.add_plot(**{"Prediction Scatter": "prediction_scatter.png"})

mae = mean_absolute_error(y_test, y_pred)
mse = mean_squared_error(y_test, y_pred)
r2 = r2_score(y_test, y_pred)
model_card.add_metrics(
    **{"Mean Absolute Error": mae, "Mean Squared Error": mse, "R-Squared Score": r2}
)
Card(
  model=Pipeline(steps=[('scaler', Standar..._regression', LinearRegression())]),
  Model description=This is a Linear Regression ...`skops` and Hugging Face Hub.,
  Model description/Intended uses & limitations=This model is ... in production.,
  Model description/Training Procedure/Hyperparameters=TableSection(14x2),
  Model description/Training Procedure/Model Plot=<style>#sk-co...script></body>,
  Model description/Evaluation Results=TableSection(3x2),
  Model Card Authors=skops_user, lazarust,
  Citation=bibtex @inproceedings{...,year={2022}},
  Intended uses & limitations=This model is made for ...o be used in production.,
  Prediction Scatter=PlotSection(prediction_scatter.png),
)
Save model card
We can simply save our model card by providing a path to Card.save().
The model hasn’t been pushed to Hugging Face Hub yet, if you want to see how
to push your models please refer to
this example.
model_card.save(Path(local_repo) / "README.md")
Total running time of the script: (0 minutes 0.117 seconds)